
There is a particular kind of frustration that most eCommerce business owners eventually experience.
The traffic is there. People are arriving. Sessions are being logged. And then nothing, or not nearly enough. The orders trickle in at a rate that doesn't justify what you're spending on ads, on SEO, on the website itself. Every month feels like you're pouring money into a bucket with a hole in the bottom, and the harder you push on marketing, the more expensive each sale becomes.
This is what a low conversion rate looks like from the inside. Not a dramatic crash just a persistent, expensive gap between the traffic your business generates and the revenue it produces from that traffic.
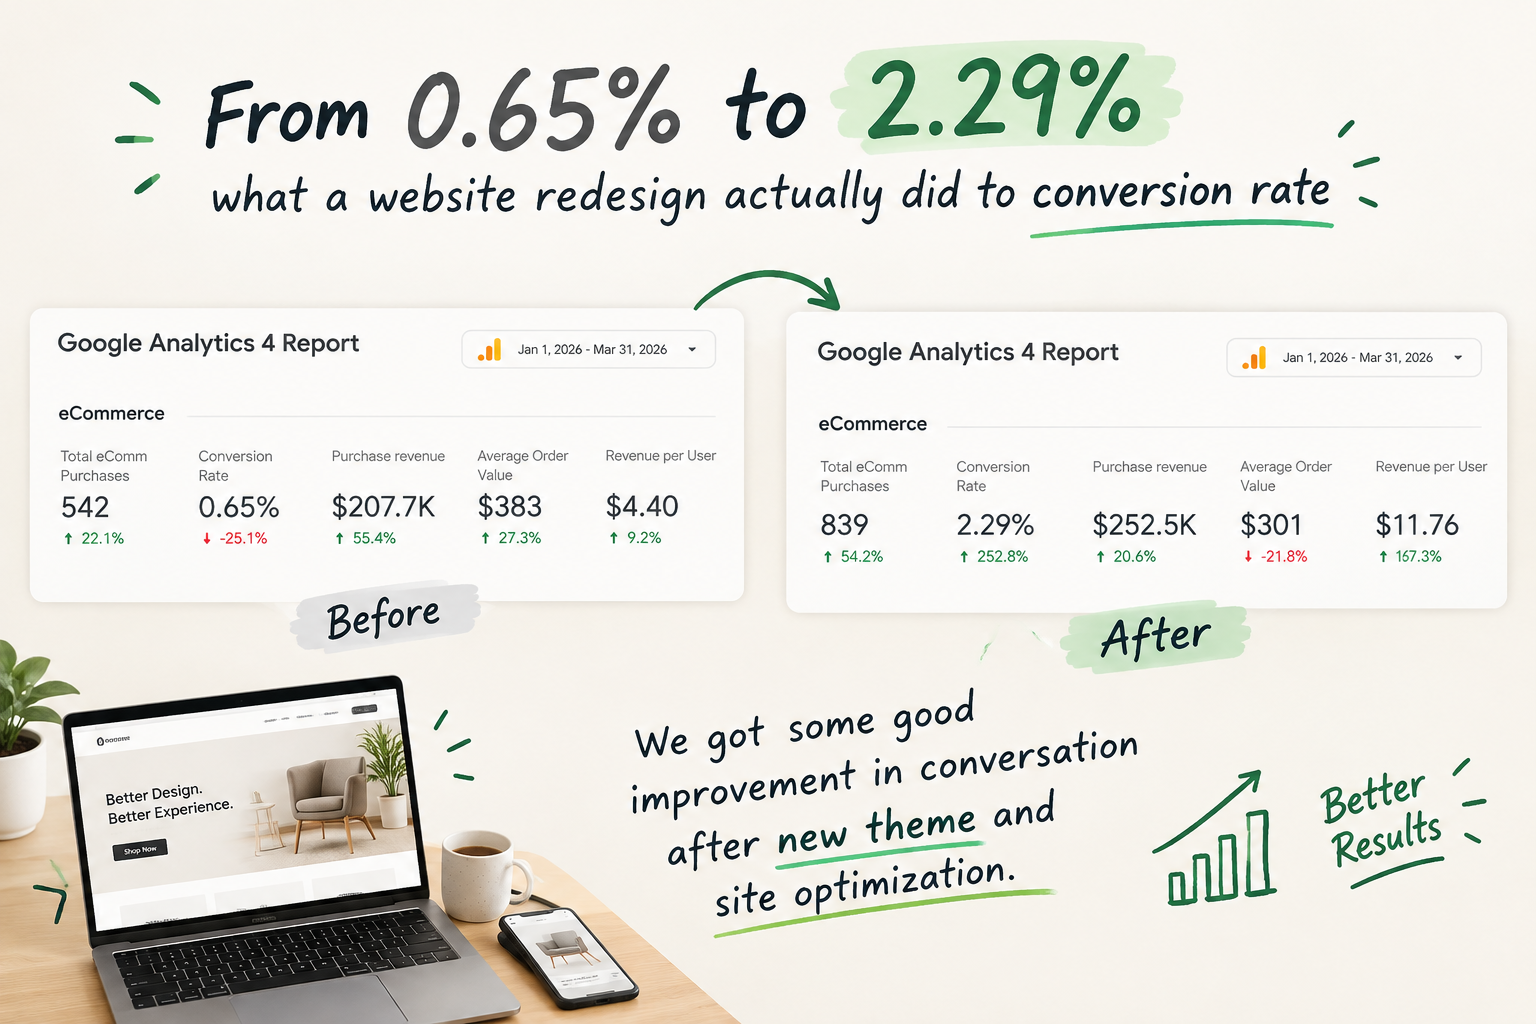
In this case study, we're sharing what happened when we addressed exactly that problem for a UK-based healthcare eCommerce business. Their Google Analytics 4 data showed a conversion rate of 0.65% in the three months before a new website theme launched on 23 March 2026. In the three months after the launch, the same GA4 report showed a conversion rate of 2.29%.
We're going to tell you what that means, what we believe contributed to it, what we can't claim with certainty, and most importantly what it might mean for your own store.
What these numbers actually mean
Before we go any further, it's worth being precise about what we're comparing, because precision matters when you're using numbers to make business decisions.
The conversion rate figures come from Google Analytics 4 eCommerce reports. GA4 calculates eCommerce conversion rate as the percentage of sessions in which a purchase event was recorded. A session where a visitor browsed but left without buying is counted as a non-converting session. The formula is straightforward:
The absolute change is +1.64 percentage points - from 0.65% to 2.29%. The relative change is approximately 252%, meaning the post-launch conversion rate is about 3.5 times higher than the pre-launch rate. Both describe the same shift in the data.
| Metric | Before (Jan–Mar 2026) | After (Apr–Jun 2026) | Change |
|---|---|---|---|
| eCommerce conversion rate | 0.65% | 2.29% | +1.64 percentage points (~252% relative) |
| Reporting period | 3 months | 3 months | Equal-length periods |
| New theme launch | 23 March 2026 : dividing point between both periods | ||
| Data source | Google Analytics 4 eCommerce reports : original GA4 data | ||
About the client and the challenge they faced
Healthcare Direct is a UK-based supplier of medical and care home products that has been trading since 1993. They supply care homes, NHS facilities, individuals, and businesses with over 4,000 products, nursing beds, continence care, mobility aids, infection control supplies, specialist seating, and much more.
Their eCommerce platform, built on nopCommerce, carries a deep and complex product catalogue. That complexity is a commercial strength they can serve almost any purchasing need a care organisation has but it also creates a genuine usability challenge. When a care home manager needs a specific type of continence pad in the right absorbency and size, or a clinical buyer needs to compare two pressure-relief mattresses against specific weight tolerances, the website has to make that process easy. If it doesn't, the visitor leaves.
A 0.65% conversion rate in the context of a business with 30+ years of trading history and a strong product range isn't a reflection of what the business is worth. It's a reflection of how well the website was translating genuine purchase intent into completed orders. And at 0.65%, the answer was: not as well as it could.
What a 0.65% conversion rate costs in practical terms
- Roughly 9,935 visitors leave for every 65 who buy
- Every pound spent on paid traffic converts at roughly 1 in 154 visitors
- SEO traffic, built over years, delivers far less revenue than it should
- Marketing scale makes the problem worse, not better
- Each lost visitor is a potential loyal B2B account that didn't start
What a 2.29% conversion rate changes
- Roughly 3.5x more purchases from the same visitor volume
- Every pound of ad spend produces approximately 3.5x more orders
- Organic traffic now generates substantially more revenue
- Marketing becomes worth scaling because the store is working
- More first orders means more repeat B2B accounts over time
Why established websites often convert poorly and why it's hard to see from the inside
Here's something I've observed consistently in 15 years of working on eCommerce websites: the businesses with the lowest conversion rates relative to their potential are rarely the ones with bad products or bad marketing. They're the ones with websites that have grown in complexity faster than they've grown in clarity.
It happens gradually. A category structure that made sense with 500 products becomes confusing with 4,000. Navigation that worked on desktop feels clunky on mobile. Product pages that were built for one type of buyer don't quite answer the questions of a different type of buyer who now accounts for a larger share of traffic. Trust signals that should be visible at the moment of purchase decision are buried in footers.
The people who run these websites don't see these problems clearly, because they know the site too well. They know where everything is. They know which product is in which category. They navigate intuitively in a way a first-time visitor never can. And so the friction points that cause visitors to leave go unnoticed until the analytics are examined carefully.
The areas that most often determine eCommerce conversion rate
In a healthcare and medical supply context specifically but really in almost any B2B or considered-purchase eCommerce category there are five areas that most directly determine whether a visitor with genuine purchase intent completes an order or leaves.
Can visitors find what they're looking for without effort?
Navigation and product discovery are the first filter. If a buyer who knows exactly what they need can't find it within a few clicks, they leave. The deeper and more complex the catalogue, the more important it is that the category structure, search, and filtering reflect the way buyers actually think about products not the way the business has organised its internal inventory. This is harder to get right than it sounds, and it's almost never right by default.
Does the product page answer the questions a buyer needs answered?
A care home manager ordering a profiling bed has specific questions: what are the minimum and maximum platform heights, what is the user weight capacity, does it come with side rails, what is the lead time? A product page that shows a photo, a price, and three lines of description doesn't answer those questions. The visitor makes a mental note to check the manufacturer website or call for more information and often doesn't come back. Product pages that anticipate and answer the buyer's specific questions before the buyer has to ask them convert at substantially higher rates.
Does the mobile experience work for the people actually using it?
B2B buyers increasingly research and place orders on mobile devices during site visits, between meetings, on the move. If the mobile experience of your website is a compressed, finger-unfriendly version of the desktop layout, you're losing orders from people who genuinely intended to place them. Mobile conversion rates lag desktop rates on most sites, but the gap between them is not fixed it's a function of how well the mobile experience was designed for the people using it.
Does the site give buyers enough confidence to commit?
Trust signals, delivery information, returns policy, years of trading, certifications, contact details need to be visible at the moment a buyer is deciding whether to purchase, not buried in a footer page that nobody visits. For a healthcare supply business serving care homes and clinical buyers, credibility is not assumed. It needs to be clearly communicated at every point in the buying journey where doubt might otherwise cause a visitor to pause and leave.
Is the checkout simple enough not to lose people at the final step?
A visitor who reaches checkout has already decided they want to buy. Losing them at this stage because the checkout is confusing, asks for unnecessary information, doesn't offer appropriate payment options, or surprises them with shipping costs they hadn't seen is the most expensive conversion failure there is. These buyers were already converted. The checkout process un-converted them. Fixing checkout friction is consistently one of the highest-return interventions in CRO, precisely because it acts on buyers who were already committed.
What changed and what we can and can't claim
A new website theme launched on 23 March 2026. The three months before that date showed a 0.65% eCommerce conversion rate in Google Analytics 4. The three months after showed 2.29%.
We believe the website redesign contributed to that improvement. The timing is consistent with it. The scale of the change roughly 3.5 times more purchases per visitor is the kind of shift that typically follows meaningful improvements to user experience, navigation, and product page clarity rather than smaller optimisations or external factors alone.
What we won't claim is that the redesign was the only cause. A proper attribution analysis would examine:
- Whether the traffic mix changed between periods more branded search, different referral sources, or a different paid/organic balance can all shift conversion rate independently
- Whether there were seasonal patterns in buyer behaviour that typically distinguish Q1 from Q2 in this product category
- Whether any changes to GA4 tracking configuration coincided with the launch and affected how conversions were counted
- Whether any external factors a competitor's site going down, a trade campaign, a change in market conditions could have influenced purchase behaviour in this period
We're being transparent about these caveats not to diminish the result, but because we think honesty about what data can and can't establish is more useful to you than inflated claims that don't survive scrutiny.
What every business owner can take from this
Regardless of what specific combination of factors produced the numbers in this case, there are things worth carrying away from it.
The practical lessons
- A low conversion rate is almost always a fixable problem not a ceiling imposed by your market or product
- Traffic investment amplifies whatever conversion rate your store already has if that rate is low, more traffic is an expensive way to find out
- Most of the friction points that kill conversions are invisible to the people who run the website they require an outside perspective and data to identify
- You need to measure before you change anything baseline data is the only way to know whether an intervention worked
- Google Analytics 4 eCommerce reports give you the conversion rate picture; session recordings and heatmaps show you where people are leaving and why
- Conversion rate is the lever that makes everything else, SEO, ads, social produce better returns without spending more
The most important single thing you can do right now, if you haven't done it already, is open your GA4 eCommerce report and find out what your current conversion rate is. Not a monthly estimate, not a feeling the actual figure, by device, by traffic source, for the last 90 days. That number tells you how much revenue your current traffic is actually producing per visitor, and by implication, how much it's leaving on the table.
For most eCommerce sites, that number is lower than it should be. And unlike adding more traffic which costs more money improving conversion rate generates more revenue from what you're already spending.
How we approach conversion rate optimisation projects
Every CRO engagement we take on starts the same way: not with recommendations, but with understanding. We look at the analytics first, because the data tells us where to look before we look at anything else.
The general workflow:
- GA4 audit and tracking verification : is the conversion tracking reliable? Are purchase events firing correctly? Can we trust the before data we're working from?
- Funnel analysis : at which step are visitors leaving? Is the drop-off at product discovery, product pages, add-to-cart, checkout initiation, or payment completion?
- Device and traffic source breakdown : is mobile converting at a much lower rate than desktop? Is one traffic source converting well and another poorly?
- Heatmap and session recording review : where are visitors actually clicking, scrolling, and pausing? What does real usage look like on the pages with the highest exit rates?
- Prioritise by impact : not everything gets addressed at once. We identify the changes most likely to move conversion rate for this specific audience and product context, and address those first
- Implement and measure : changes are made, GA4 is verified to be capturing them correctly, and we track conversion rate in the period after against the established baseline
- Continue the cycle : CRO is not a one-time project. What the data shows after the first round of improvements guides what to address next
Also read: How to audit your store before investing in marketing →
A conversion rate of 0.65% is not a given. It's a number that reflects the current state of a website's ability to turn visits into purchases and like most things about a website, it can be changed.
The GA4 data from this project shows a conversion rate of 2.29% in the three months after a new theme launched, compared to 0.65% in the three months before. We've been transparent about what this data does and doesn't prove, and we've shared the context that explains why both numbers are meaningful.
If your own conversion rate is lower than it should be and for most businesses it is — the gap between where you are and where you could be represents real, accessible revenue. Not from spending more on ads. Not from changing your products or prices. From making better use of the traffic you're already earning.
That gap starts with knowing your current number. And it closes with understanding specifically what's causing visitors to leave before they buy.
Want to find out what's stopping your website from converting?
A CRO audit looks at your GA4 data, conversion funnel, navigation, product pages, checkout, and mobile experience and identifies the specific friction points costing you purchases. We tell you what we find, explain what we'd recommend, and leave the decision with you. No guaranteed outcomes, no invented case studies, no hard sell.
Request a free CRO audit →Frequently asked questions